Waggle Index™: Agentic Commerce Readiness, Q4 2026
The Agentic Commerce Gap: how many leading Amazon brands are missing from AI shopping answers, and what it means for every consumer brand.
Key findings
Only about 1 in 4 leading Amazon.com brands is ready for agentic commerce. We tested 134 top brands from 12 of the largest revenue categories against 540 AI shopping answers and 1,652 graded fact checks from ChatGPT, Gemini and Claude. Just 34 of the 124 brands with a testable best seller cleared both bars in every category where they compete: named in at least 1 in 10 AI shopping answers, and no material errors about their best-selling product. Across all seven readiness dimensions, the average brand scores 60 of 100 on the Waggle Index™, and only 12 of 134 score 80 or above: Zinus, The Ordinary, Transparent Labs, Royal Canin, simplehuman, Open Farm, Naked, Sweetnight, Beats, Apple, Orgain and Optimum Nutrition. Nine of the 12 sell their best seller directly from their own site.
For brand executives
Your Amazon rank is not your AI rank. Brands ranked top three by Amazon sales averaged a 42% AI mention rate, and 12 of those 36 leaders were named in fewer than 1 in 10 answers.
Readiness is low even among leaders. The top three Amazon brands in each category average 67 on the 100-point Waggle Index; 11 of those 36 score below 60. Amazon sales share predicts the score only weakly (0.25 correlation).
Amazon-only strength is the most exposed position. Brands strong on Amazon but absent from Google Shopping averaged an 11% mention rate, and 11 of 25 were never named; brands strong on both shelves averaged 56%.
Your AI competitors may not be your Amazon competitors. In 17% of answers, the assistant named none of the category's 12 Amazon leaders, recommending direct-to-consumer, specialist or adjacent brands instead.
Being recommended does not mean being described correctly. 13 of the 44 brands assistants name in at least a quarter of answers had at least one material fact about their best seller stated incorrectly. Certifications, usage and compatibility, and price and pack size were the weakest facts.
Your product data disagrees with itself. 80% of best sellers compared had at least one attribute that differed between the brand site, Amazon and other stores; half had an attribute with two or more competing values.
Your firewall may block the agents your robots.txt welcomes. 15 of 124 brand websites refused AI answer-engine agents, 12 of them established brands; 8 of the 15 have robots.txt files that allow AI crawlers. Another 9 refused the audit’s plain browser request, so the agent test there was inconclusive.
The fix starts on your own website. Machine-readable product data is the weakest scored dimension (45% of points). Brand websites answered fewer than half (48%) of agent questions about their own best sellers, 63% of the brands whose product pages we could sample publish no GTIN in their markup, and only half of best sellers can be bought directly from the brand, by a shopper or an agent.
Why this matters now
AI assistants are moving from answering shopping questions toward completing purchases. OpenAI and Stripe launched in-chat checkout in ChatGPT in September 2025, built on their Agentic Commerce Protocol; OpenAI has since withdrawn that feature, but the push to let agents buy on a shopper's behalf continues. McKinsey estimates that agentic commerce could orchestrate up to $1 trillion of US consumer retail revenue by 2030 (October 2025), and a McKinsey ConsumerWise survey found that 68% of US consumers had used at least one AI tool in the previous three months (February 2026).
When an assistant answers "What is the best protein powder for weight loss?", it typically names three to five brands. A brand that is not on that short list does not lose a ranking position; it disappears from the decision. Amazon search shows a shopper pages of options. An AI answer shows a shortlist.
For consumer brands, three things change at once:
The shelf moves. The assistant's answer becomes the first shelf a shopper sees, before Amazon or any retailer site.
The gatekeepers change. Assistants build their shortlist from reviewers, testers and editors, not from marketplace sales rank.
The data has to be right everywhere. An assistant that buys on a shopper's behalf acts on whatever product facts it finds, from any source.
The three gaps
A brand is ready for agentic commerce when AI assistants name it, describe it correctly and can read its product data. Each is a separate gap, and closing one does not close the others.
| Gap | The question | What we measured | Headline result |
|---|---|---|---|
| Visibility | Do AI assistants name your brand when shoppers ask? | 540 AI answers to unbranded shopper questions, plus a consumer-app check | 44% of brands never named |
| Accuracy | When they name you, do they get your product facts right? | Five factual questions per hero product, graded against the brand's own data: 1,652 graded answers | 45% of brands had at least one material error |
| Access | Can AI agents read your product data directly? | Crawler rules; whether brand websites publish the facts agents ask for | 15 brand sites refuse AI agents (9 more inconclusive); 63% of sampled brands publish no GTIN in product markup |
The visibility gap costs brands the recommendation. The accuracy gap costs them the sale, or the return: an assistant that states the wrong size, ingredient or warranty sends the shopper elsewhere or sets up a disappointed customer. The access gap determines whether a brand can fix either.
Combining the first two gaps for the 134 brand-category positions with a testable best seller (each brand counted once per category):
| Position | Brand positions | Share |
|---|---|---|
| Named in at least 1 in 10 answers, no material errors | 39 | 29% |
| Named in at least 1 in 10 answers, at least one material error | 17 | 13% |
| Rarely or never named, no material errors | 36 | 27% |
| Rarely or never named, and at least one material error | 42 | 31% |
The largest group is the worst position: brands that assistants rarely recommend and also misdescribe.
Gap 1, visibility: Amazon leaders that AI assistants do not name
Sales rank on Amazon tells you little about whether AI assistants will recommend you. Visibility falls off sharply below the top three, and even the top three are far from safe.
| Amazon sales rank in category | Brand positions | Avg AI mention rate | Named in fewer than 1 in 10 answers | Never named |
|---|---|---|---|---|
| #1–3 | 36 | 42% | 12 | 8 |
| #4–6 | 36 | 23% | 16 | 9 |
| #7–10 | 48 | 11% | 36 | 25 |
| Fast-growing challengers | 24 | 1% | 24 | 20 |
Shelf presence helps, but the open-web shelf decides who is left out. A brand's presence in Amazon's top 100 correlated with its AI mention rate at 0.59, and its presence in Google Shopping's top 100 at 0.49; yet brands strong on Amazon but absent from Google Shopping averaged 11%, against 56% for brands strong on both.
| Shelf profile | Brand positions | Average AI mention rate | Never named |
|---|---|---|---|
| Strong on Amazon and Google Shopping | 21 | 56% | 1 |
| Strong on Amazon, some Google Shopping presence | 16 | 44% | 0 |
| Strong on Google Shopping only | 7 | 30% | 1 |
| Strong on Amazon, absent from Google Shopping | 25 | 11% | 11 |
| Thin on both | 75 | 7% | 49 |
Even the best-positioned group is not fully safe: 2 of the 21 brands strong on both shelves were named in fewer than 1 in 4 answers.
The brands assistants do recommend are often not the ones a consumer brand team benchmarks against. In 17% of answers, the assistant named none of the category's 12 Amazon leaders, recommending direct-to-consumer brands, specialist brands or adjacent products instead. A brand can lead its Amazon category and still lose the AI recommendation to a competitor it does not track. Google AI Mode, asked the same questions but not scored, named none of the 12 leaders in 25% of its answers, and its average mention rate for tracked brands was 14%, against 20% for the three scored assistants.
Where the visibility gap is widest
The gap appears largest where independent testing and editorial coverage favor brands other than Amazon's leaders. The table ranks categories by the share of tracked Amazon revenue held by brands AI assistants never named.
| Category | Amazon revenue held by never-named brands | Average mention rate, top 3 Amazon brands | Answers naming any tracked brand | Readiness |
|---|---|---|---|---|
| Mattresses | 74% | 1% | 53% | Disconnected |
| Facial serums | 58% | 12% | 84% | Split |
| Bed frames | 56% | 3% | 38% | Disconnected |
| Face moisturizers | 38% | 62% | 100% | Split |
| Trash bags | 24% | 68% | 89% | Aligned at the top |
| Earbuds | 15% | 47% | 96% | Split |
| Protein drinks | 14% | 39% | 80% | Split |
| Body wash | 9% | 21% | 87% | Split |
| Furnace filters | 9% | 58% | 91% | Aligned at the top |
| Whey protein | 9% | 56% | 80% | Aligned at the top |
| Dry dog food | 7% | 71% | 100% | Aligned |
| Laptops | 4% | 70% | 100% | Aligned |
Disconnected: assistants recommend a different set of brands. In mattresses, the four largest Amazon brands, holding 64% of tracked revenue, appeared in only 2 of 45 answers; assistants recommended direct-to-consumer brands covered heavily by sleep-research and testing sites.
Split: one or two leaders are visible while brands with similar shelf strength go unmentioned. In facial serums, 8 of 12 brands were never named, including the #2 Amazon brand.
Aligned: Amazon leaders also have deep independent coverage, and assistants repeat it. Laptops and dog food are the clearest cases.
The pattern carries beyond these 12 categories. Any category where marketplace-native brands have won share without earning reviewer and editorial coverage is a candidate for the same disconnect.
Gap 2, accuracy: when AI names you, does it get your facts right?
AI assistants get most product facts right, but nearly half of the brands had at least one material error about their best-selling product, and brands' own websites supplied fewer than half of the facts that assistants need.
We asked ChatGPT, Gemini and Claude five factual questions about each brand's hero product (its best-ranked listing on the Amazon shelf, or on the Google Shopping shelf for brands with no Amazon top-100 listing) and graded every answer against the brand's own published data: its website first, then its own Amazon listing. The check covered 137 hero products and 1,652 graded answers.
| Outcome | Share of graded answers |
|---|---|
| Correct on every fact | 76% |
| Partly correct (incomplete or one minor error) | 17% |
| Incorrect: contradicts the brand's own data on a material fact | 7% |
Errors are widespread across brands. 56 of 124 brands (45%) received at least one incorrect answer about a hero product; 15 hero products received three or more.
Visible brands are not safe. 13 of the 44 brands named in at least a quarter of AI shopping answers had at least one fact about their best seller stated incorrectly.
The two gaps compound. Brands AI assistants never recommended were also described least accurately: 60% had at least one error, against 38% of brands strong on both Amazon and Google Shopping. Fast-growing challengers averaged 81% accuracy against 85% for established brands.
The errors fall on exactly the facts that decide a purchase:
| Fact type | Accuracy | Incorrect answers |
|---|---|---|
| Certifications and third-party testing | 79% | 10% |
| Usage and compatibility | 80% | 9% |
| Price and pack size | 80% | 15% |
| Performance claims (battery life, ratings) | 82% | 10% |
| Warranty and returns | 82% | 7% |
| Specifications and features | 83% | 7% |
| Ingredients and composition | 91% | 4% |
Typical errors: three extra sizes listed for a bed frame the brand sells only in queen; a bed frame's weight capacity given as 800 pounds when the brand lists 900; a laptop's memory given as DDR4 when the brand lists DDR5; earbud battery life given as 9 hours when the brand lists 6; a dog food's first ingredient given as corn when the brand lists chicken by-product meal; “dermatologist-tested” claims the brand does not make.
Brands are not publishing the facts. Of 685 agent-critical questions about each brand's own best-selling product, the brand's website answered 48%. The brand's Amazon listing filled another 38%, and 15% were answered nowhere, leaving assistants to source the answer elsewhere. For 50 of 137 hero products, the brand's website answered none of the five questions, and for 24 of the 130 hero products from brands with a website (18%), we could not find the product's page on the brand website at all. Only 27 hero products had all five questions answered on the brand's own site.
| Category | Accuracy | Incorrect answers | Questions answered on brand site (of 5) |
|---|---|---|---|
| Bed frames | 67% | 26% | 2.6 |
| Laptops | 81% | 9% | 2.2 |
| Furnace filters | 81% | 7% | 1.8 |
| Face moisturizers | 82% | 9% | 1.9 |
| Facial serums | 84% | 5% | 1.2 |
| Body wash | 84% | 7% | 1.5 |
| Earbuds | 85% | 6% | 2.4 |
| Mattresses | 86% | 3% | 2.3 |
| Whey protein | 87% | 8% | 1.3 |
| Trash bags | 87% | 6% | 3.0 |
| Dry dog food | 91% | 3% | 1.7 |
| Protein drinks | 94% | 3% | 0.7 |
Claude made the fewest material errors (6% of answers), against 7% for ChatGPT and 9% for Gemini. Gemini was tested on its lighter Flash model, so the comparison reflects the models tested, not each assistant at its best. Google AI Mode, graded the same way but not scored, made a material error in 10% of its graded answers, and 73 of its 690 requests returned errors.
A 7% error rate is tolerable when a shopper reads the answer and checks the product page. It is not tolerable when an agent completes the purchase: every material error becomes a wrong-size, wrong-formula or wrong-warranty order, and a likely return.
The facts conflict across stores, too. We compared each best seller's attributes on the brand's site, its Amazon listing and other retailer and reseller listings found by UPC or model number. Of the 131 products with enough sources to compare:
105 (80%) had at least one attribute that disagreed between stores.
65 (50%) had an attribute where the sources split into two camps or showed three or more different values.
Only 26 (20%) matched on every attribute compared.
The most frequent conflicts were color and variant names, model numbers, volume and pack count, flavor and scent, and processor specs. Brands strong on both Amazon and Google Shopping had the lowest consistency (14.8 of 20, against 15.8 for Amazon-only brands): more channels means more copies of the product data to keep in sync. An assistant that reads several stores and finds different answers has to pick one; conflicts like these are a likely source of some of the accuracy errors above.
Gap 3, access: can AI agents read your product data?
Few brands have made a deliberate decision about AI agents. Of the 125 brand websites we checked (7 of the 134 brands have no website, and two pairs of sister brands share a site):
| Crawler policy | Brand websites | Share |
|---|---|---|
| No AI-specific rules; crawlers allowed by default | 105 | 84% |
| Explicitly welcome AI crawlers | 10 | 8% |
| Firewall refused an AI user agent reading robots.txt | 8 | 6% |
| Rules that block some AI search crawlers | 1 | 1% |
| Site did not respond | 1 | 1% |
Today, access matters less than coverage: assistants lean on third-party sources, so brands whose firewall turned away an AI user agent were named at least as often as brands whose robots.txt allows AI crawlers (26% of answers against 20%). The seven brands with no website were the exception, averaging a 3% mention rate. The eight firewall refusals in this table are a different group from the 15 sites that refused AI agents in the site audit below; six brands appear in both.
That will change as assistants move from recommending to buying. An agent completing a purchase needs current price, availability, variants and specifications, and the brand's own site or feed is the only authoritative source for them. A brand that blocks agents, or serves product pages that agents cannot parse, leaves them to act on whatever a reseller or outdated listing says.
The accuracy check shows the cost of that gap already. Brand websites answered fewer than half (48%) of the questions agents ask about each brand's own best seller, and for 18% of hero products from brands with a website, the brand had no findable page for that product. Every unanswered question is one an agent answers from a reseller, a review or a guess.
Some of the best-known brands turn AI shopping agents away. A site audit loaded up to five product pages per brand as a browser and as four AI answer-engine agents (OAI-SearchBot, ChatGPT-User, Anthropic’s Claude-SearchBot and Claude-User), counting a refusal only when it was consistent, not a one-off server error or rate limit. Of 124 brand websites (sister brands that share a site counted once):
| What the AI agents ChatGPT and Claude met | Brand websites |
|---|---|
| Pages open to every answer-engine agent | 100 |
| Refused all answer-engine agents | 15 |
| Refused some answer-engine agents | 0 |
| Refused the audit’s plain browser request, so the agent test was inconclusive (page loading scored from the October 10 check) | 9 |
Six of the 15 sites loaded normally for an ordinary browser but refused the agents; the other nine refused every automated request, agents included. Twelve of the 15 belong to established brands. Eight of the 15 have robots.txt files that allow AI crawlers, so the refusal comes from bot protection the brand may not know is turned on; six also refused an AI user agent reading their robots.txt. The 9 inconclusive sites refused the audit’s plain browser request but loaded in an earlier check; firewalls that admit verified AI crawlers by network address may still let real agents through, so results for these sites are inconclusive.
Product pages carry markup, but not the identifiers agents need to match products. Across 105 brand websites where the audit could load product pages (up to five pages each, 476 pages in all):
Product markup appeared on 90% of pages; the name and price were readable without JavaScript on 71%.
Price was marked up on 70% of pages and availability on 71%; 63 brands marked up both on every page.
A GTIN (the barcode number agents use to match a product across stores) appeared on only 30% of pages; 66 of the 105 brands (63%) published none.
Only 16 brands carried complete markup (product, price, availability and a valid GTIN) on every page sampled.
Ratings appeared in markup on 32% of pages, FAQ markup on 18% and specification tables on 27%.
Half of best sellers can be bought directly from the brand. For 70 of the 144 best sellers tested (one per brand in each category), the brand sells the product on its own site with a price and an add-to-cart button; 5 show a price but no way to buy, 19 send shoppers to retailers instead, and 50 offer neither on a findable product page. When an agent is ready to buy, the brand's own checkout is the only purchase path the brand controls.
The site audit's requests carried the agents' names but came from our own network rather than OpenAI's or Anthropic's, and some bot protection checks where a request comes from as well as what it calls itself, so treat individual results as strong indications, not proof. The audit did not test a Google agent, so it does not cover access for Gemini.
The Waggle Index
The Waggle Index™ is our Agent Readiness Score: a 100-point measure of how ready a brand is for AI shopping agents, across seven dimensions.
Why “Waggle.” Honeybees perform a waggle dance to tell the hive where the best food is. AI agents now do the same for shoppers, pointing them to the brands worth buying. The Waggle Index measures how ready a brand is to be the one they point to.
Each brand receives a score out of 100 across seven dimensions, so executives can compare readiness the way they compare share or ratings.
| Dimension | Points | What it measures | Average | Share of points earned |
|---|---|---|---|---|
| Agent access: crawler rules | 8 | robots.txt rules for AI crawlers | 6.3 | 79% |
| Agent access: page loading | 7 | Whether product pages load for the AI agents ChatGPT and Claude use (site audit, up to five pages per brand) | 6.1 | 86% |
| Machine-readable product data | 20 | Product markup, price, availability, valid GTIN, model or SKU, attributes, visible name and price, spec tables, averaged across sampled product pages | 9.1 | 45% |
| Cross-channel consistency | 20 | Whether product facts match across the brand site, Amazon and other stores (131 best sellers) | 15.9 | 80% |
| Evidence and trust | 15 | Coverage by the publications assistants cite (7), Amazon ratings (5), certifications (3) | 7.6 | 51% |
| Agent perception | 20 | AI mention rate (10) and hero-product accuracy (10) | 11.1 | 55% |
| Availability and purchase path | 10 | Direct checkout, price and stock markup, Google Shopping presence, Amazon stock | 5.6 | 56% |
Machine-readable product data is the weakest dimension: brands earned 45% of the available points, against 51% for evidence and trust, 79–80% for crawler rules and consistency and 86% for page loading. Brands have made their sites reachable but have not made their product facts readable. Dimension averages cover only the brand-category positions where each dimension could be scored, summing to the 60-point average score.
The average leading Amazon brand scores 60 of 100. Only 12 of 134 brands score 80 or above; 36 score below 50. Brands that compete in two categories are scored on the average of their two results.
| Waggle Index score | Brands | Share |
|---|---|---|
| 80 and above | 12 | 9% |
| 70–79 | 29 | 22% |
| 60–69 | 35 | 26% |
| 50–59 | 22 | 16% |
| Below 50 | 36 | 27% |
The 12 brands that scored 80 or above. These are the only brands this report names; every other brand is described by position. Brands in two categories are shown with the average of their two scores: Zinus scored 85.1 in mattresses and 85.3 in bed frames, and Apple 82.5 in earbuds and 78.4 in laptops.
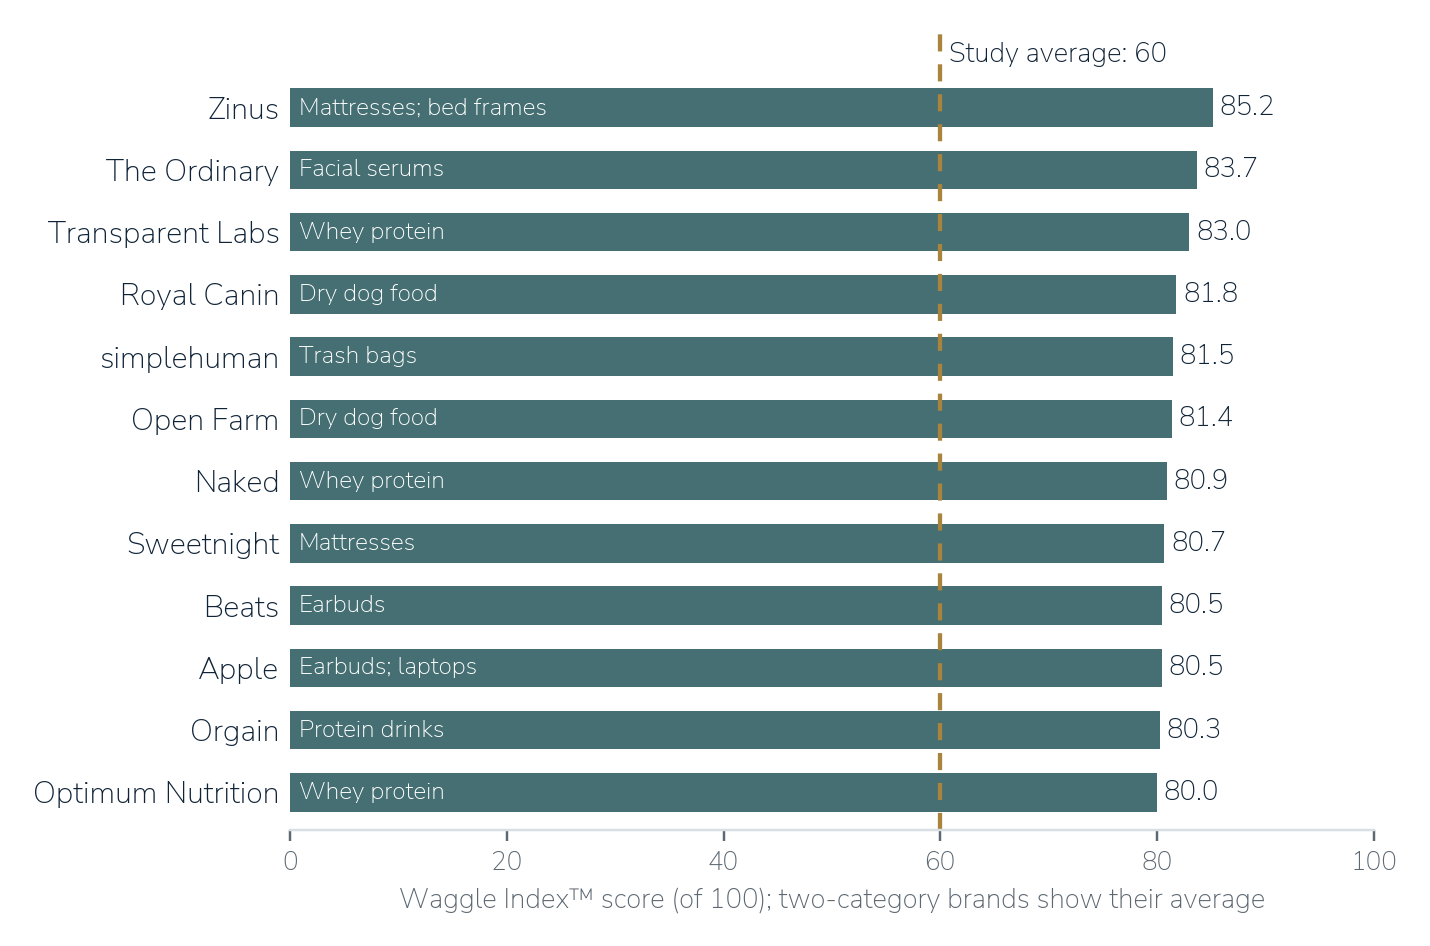
| Brand | Category | Score |
|---|---|---|
| Zinus | Mattresses; bed frames | 85.2 |
| The Ordinary | Facial serums | 83.7 |
| Transparent Labs | Whey protein | 83.0 |
| Royal Canin | Dry dog food | 81.8 |
| simplehuman | Trash bags | 81.5 |
| Open Farm | Dry dog food | 81.4 |
| Naked | Whey protein | 80.9 |
| Sweetnight | Mattresses | 80.7 |
| Beats | Earbuds | 80.5 |
| Apple | Earbuds; laptops | 80.5 |
| Orgain | Protein drinks | 80.3 |
| Optimum Nutrition | Whey protein | 80.0 |
Amazon leadership barely predicts readiness. A brand's Amazon sales share correlates with its score at only 0.25. The top three Amazon brands in each category average 67; 11 of those 36 score below 60. Fast-growing challengers average 48, against 63 for established brands.
| Category | Average score | Lowest | Highest |
|---|---|---|---|
| Whey protein | 71 | 44 | 83 |
| Facial serums | 67 | 47 | 84 |
| Earbuds | 66 | 34 | 83 |
| Dry dog food | 65 | 47 | 82 |
| Face moisturizers | 64 | 38 | 78 |
| Mattresses | 62 | 37 | 85 |
| Body wash | 62 | 34 | 78 |
| Protein drinks | 61 | 32 | 80 |
| Laptops | 56 | 35 | 78 |
| Bed frames | 56 | 24 | 85 |
| Furnace filters | 50 | 18 | 78 |
| Trash bags | 50 | 18 | 82 |
Laptops show why visibility alone is not readiness: assistants name laptop brands constantly, but blocked agents, thin product markup and conflicting specs across stores pull the category's average down to 56.
Scores are out of 100. For the 20 brand-category positions where a dimension could not be scored (consistency where too few stores carried the product, or page loading for brands with no website), the score is scaled to the points available. Agent perception gives 10 points for mention rate, reaching full marks at a 50% mention rate, and 10 for accuracy.
If your brand was not in this study
The patterns in this study describe brand positions, not specific brands, so any consumer brand can test itself against them. Your brand likely has the gap if several of these are true:
| Warning sign | What the study found |
|---|---|
| Most of your e-commerce growth has come from Amazon | Brands strong on Amazon but absent from Google Shopping averaged an 11% mention rate |
| You rank top three on Amazon but rarely appear in independent "best of" reviews | 12 of 36 top-three Amazon brands were named in fewer than 1 in 10 answers |
| You are gaining share fast on Amazon | Not one fast-growing challenger reached a 10% mention rate |
| Your products are thin on Google Shopping's first page | Amazon-strong brands without Google Shopping presence averaged 11%; with it, 44–56% |
| Your category has active testing labs or specialist reviewers that do not feature you | Assistants drew on reviewers, testing labs and Reddit; Amazon supplied 0.2% of the sources they consulted |
| Shoppers describe your category by problem or need, and your site is organized by product line | Assistants answered the shopper's need, and in 17% of answers named none of the Amazon leaders |
| Your product pages leave out warranty, certifications, sizes or pack counts, or the best seller has no page on your site | Brand websites answered 48% of agent questions about their own best sellers; 45% of brands had at least one fact stated incorrectly |
| Nobody on your team has asked an AI assistant your category's top questions this quarter | 84% of brand websites have no AI-specific crawler rules at all |
The most exposed profile is a brand that built its business on Amazon and has not yet built an equivalent presence in independent coverage and on the open web. In this study, that profile described 25 of the 62 brand positions holding five or more Amazon top-100 slots.
The executive agenda
Five questions to ask your team this week:
When a shopper asks ChatGPT, Gemini or Claude our category's top five questions, how often are we named, and who is named instead?
Which publications and testing sites do those answers cite, and which of them have reviewed our products?
How does our Google Shopping presence compare with our Amazon presence for our main search terms?
Do our product facts (specs, ingredients, warranty, price) match on our site, Amazon, Google Shopping and our top retailers?
Who owns AI visibility, and what is our policy for AI agents on our website?
90-day plan:
| Days | Action | Owner |
|---|---|---|
| 1–30 | Baseline AI visibility and accuracy across your top questions and hero products; map the sources assistants cite in your category | E-commerce / digital |
| 1–30 | Set an AI crawler policy; fix blocked or unreadable product pages | E-commerce / IT |
| 31–60 | Reconcile product data across your site, feeds, Amazon and retailers; complete your Google Merchant Center feed | E-commerce / product data |
| 31–60 | Publish answer pages for each major shopper need, with specifications, test results and certifications | Brand / content |
| 61–90 | Pitch products to the reviewers and testing labs your category's assistants cite; pursue relevant certifications | Brand / PR |
| 61–90 | Re-measure AI visibility and accuracy; set quarterly targets alongside Amazon share | E-commerce leadership |
Agentic commerce readiness belongs on the same dashboard as Amazon share and retail sales. Brands that measure it now can act before any shift shows up in their sales.
Questions this report answers
What is the Waggle Index?
The Waggle Index™ is James Thomson's Agent Readiness Score: a 100-point measure of how ready a brand is for AI shopping agents such as ChatGPT, Gemini and Claude, across seven dimensions: crawler rules, page loading, machine-readable product data, cross-channel consistency, evidence and trust, agent perception, and availability. It is named after the waggle dance honeybees use to point the hive to the best food.
How many leading Amazon brands are ready for agentic commerce?
About 1 in 4. In the Q4 2026 study of 134 leading Amazon.com brands in 12 categories, 34 of the 124 brands with a testable best seller were named in at least 1 in 10 AI shopping answers and had no material errors about their best seller. The average Waggle Index score was 60 of 100.
Which brands scored highest on the Waggle Index in Q4 2026?
Twelve brands scored 80 or above: Zinus, The Ordinary, Transparent Labs, Royal Canin, simplehuman, Open Farm, Naked, Sweetnight, Beats, Apple, Orgain and Optimum Nutrition. Nine of the 12 sell their best seller directly on their own website.
Do top Amazon brands get recommended by AI assistants?
Often not. The top three Amazon brands in each category averaged a 42% AI mention rate, and 12 of those 36 leaders were named in fewer than 1 in 10 answers. In 17% of answers, assistants named none of a category's 12 Amazon leaders.
What should a brand do first to prepare for AI shopping agents?
Ask ChatGPT, Gemini and Claude your category's top shopper questions and see who is named; check which reviewers and testing sites those answers cite; make sure your best seller has a readable page with price, add-to-cart and a GTIN; reconcile product facts across your site, Amazon and retailers; and make sure your bot protection does not block AI agents.
Is your brand in the study?
Every brand in the study has an individual result: its score on all seven dimensions, how often ChatGPT, Gemini and Claude name it, and which facts they get wrong about its best seller.
Sources
Agentic Commerce Protocol. "Buy it in ChatGPT: Instant Checkout and the Agentic Commerce Protocol," OpenAI, September 29, 2025. https://openai.com/index/buy-it-in-chatgpt/
$1 trillion estimate. "The agentic commerce opportunity: How AI agents are ushering in a new era for consumers and merchants," McKinsey & Company, October 17, 2025. https://www.mckinsey.com/capabilities/quantumblack/our-insights/the-agentic-commerce-opportunity-how-ai-agents-are-ushering-in-a-new-era-for-consumers-and-merchants
68% AI tool use. "Shopping gets an AI assist," McKinsey & Company, citing the McKinsey ConsumerWise Global Sentiment Survey, February 2026 (4,008 respondents). https://www.mckinsey.com/featured-insights/week-in-charts/shopping-gets-an-ai-assist
Waggle Index is a trademark of Equity Value Advisors.
The Agentic Commerce Brief
What changed in agentic commerce, and what it means for brands.
A concise weekly brief for brand executives navigating the shift from human-led shopping to agent-mediated commerce. Follow the developments that matter, the implications for brand control and governance, and the questions senior teams should be asking now.
Read The Agentic Commerce Brief on SubstackIf the signup form does not load, subscribe directly on Substack.